Every Websify client website is built with a Google PageSpeed Insights Performance target of 95+. We consider performance from the start, alongside design, accessibility and the enquiry journey. Below are our original public home-page tests from 21 October 2026, followed by the fixes and local checks carried out on 22 October.
What is Google PageSpeed Insights?
Google PageSpeed Insights is a free tool for checking an individual web page on mobile and desktop. Enter a URL and it produces a report with measurements and suggestions for improvement.
The Lighthouse section contains four familiar scores:
- Performance: how the page loads under the test conditions, including loading speed, blocking work and visual stability.
- Accessibility: automated checks for issues that may make the page harder to use. Manual checks are still necessary.
- Best Practices: selected checks of technical implementation and browser behaviour.
- SEO: basic checks that help search engines access and understand a page.
These are separate categories. An SEO score of 100 does not mean Performance is 100. Google's scoring guide labels 90–100 as good, 50–89 as needing improvement and 0–49 as poor. Our 95+ Performance target sits within that green range.
Real tests: Websify UK and Hong Kong
We tested https://websify.co.uk/ and https://websify.com.hk/ directly in PageSpeed Insights. The table records one mobile and one desktop Lighthouse result for each home page, captured at approximately 21:44 BST (UTC+1) on 21 October 2026.
The reports used Lighthouse 13.5.0. Mobile used an emulated Moto G Power with Slow 4G throttling; desktop used an emulated desktop with custom throttling. These are simulated page-load tests, not measurements from a visitor's own phone.
| Website / device | Performance | Accessibility | Best Practices | SEO |
|---|---|---|---|---|
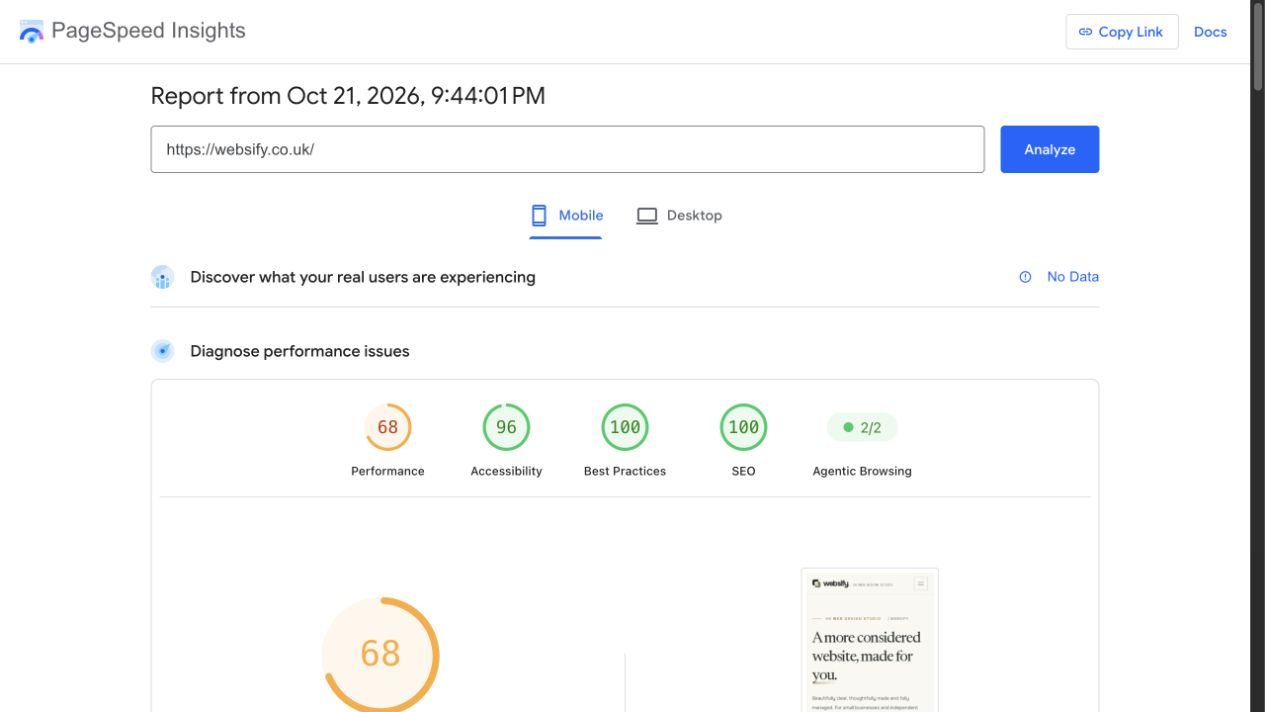
| websify.co.uk Mobile | 68 | 96 | 100 | 100 |
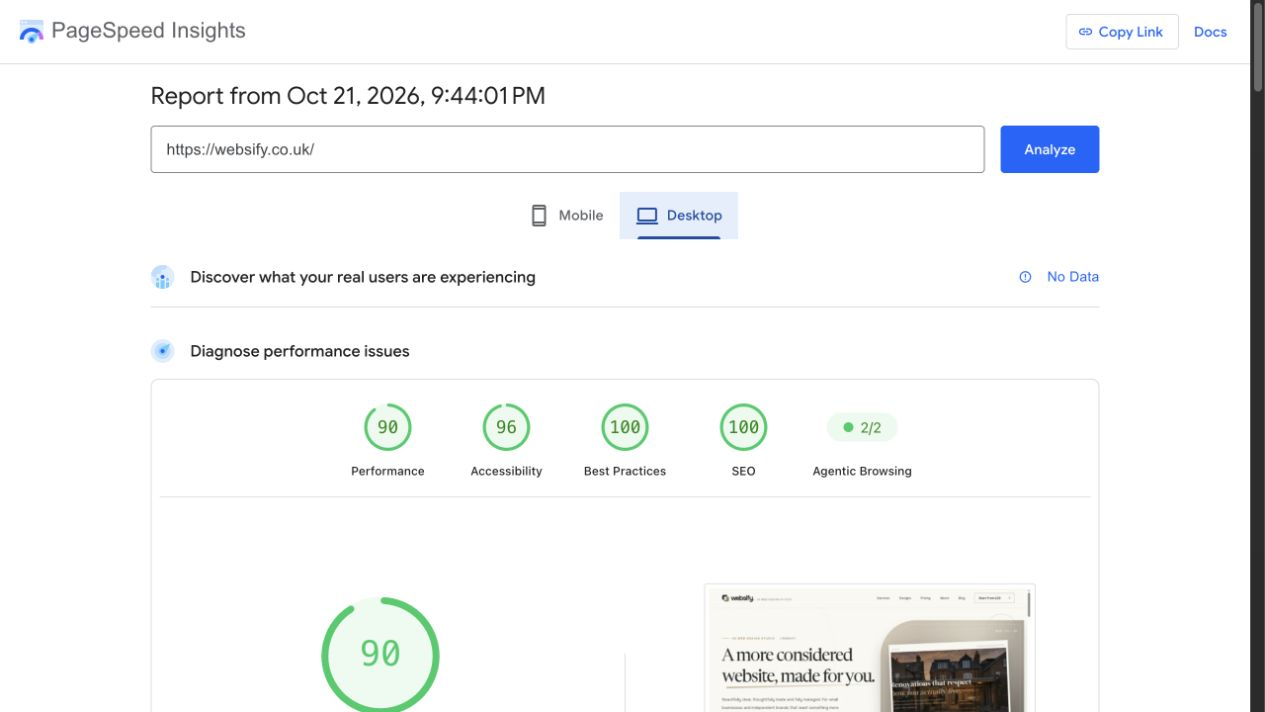
| websify.co.uk Desktop | 90 | 96 | 100 | 100 |
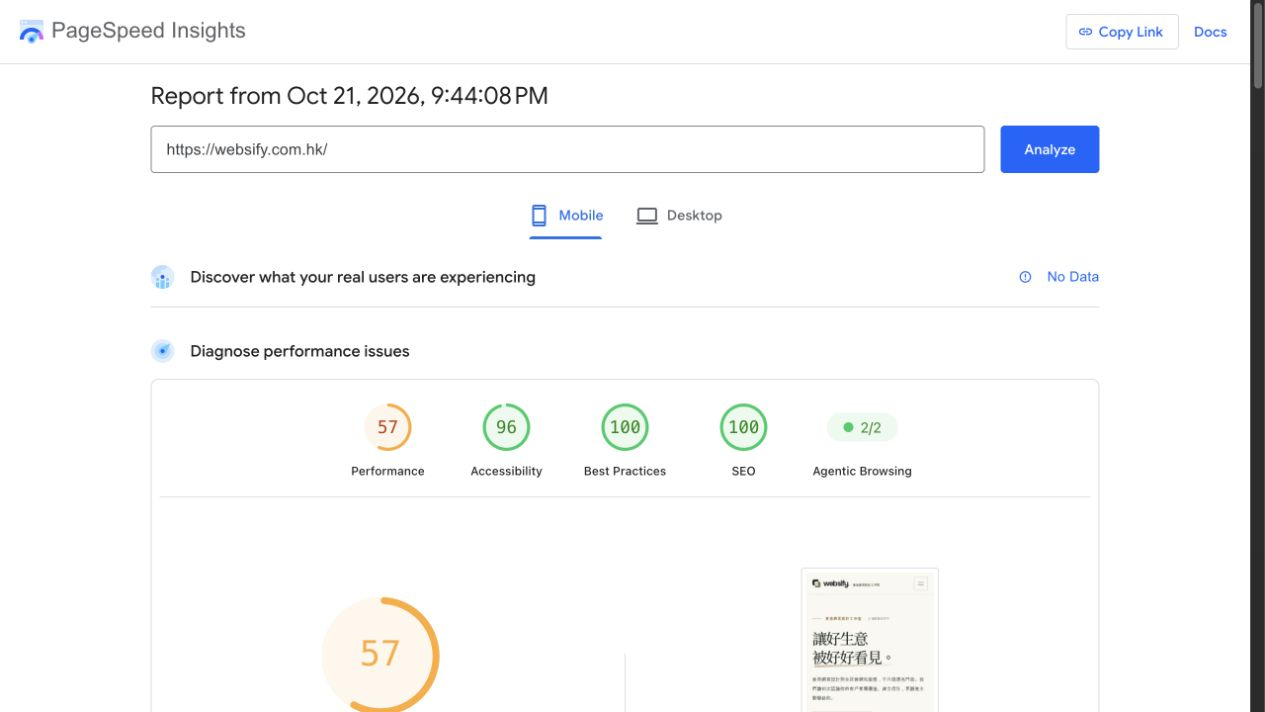
| websify.com.hk Mobile | 57 | 96 | 100 | 100 |
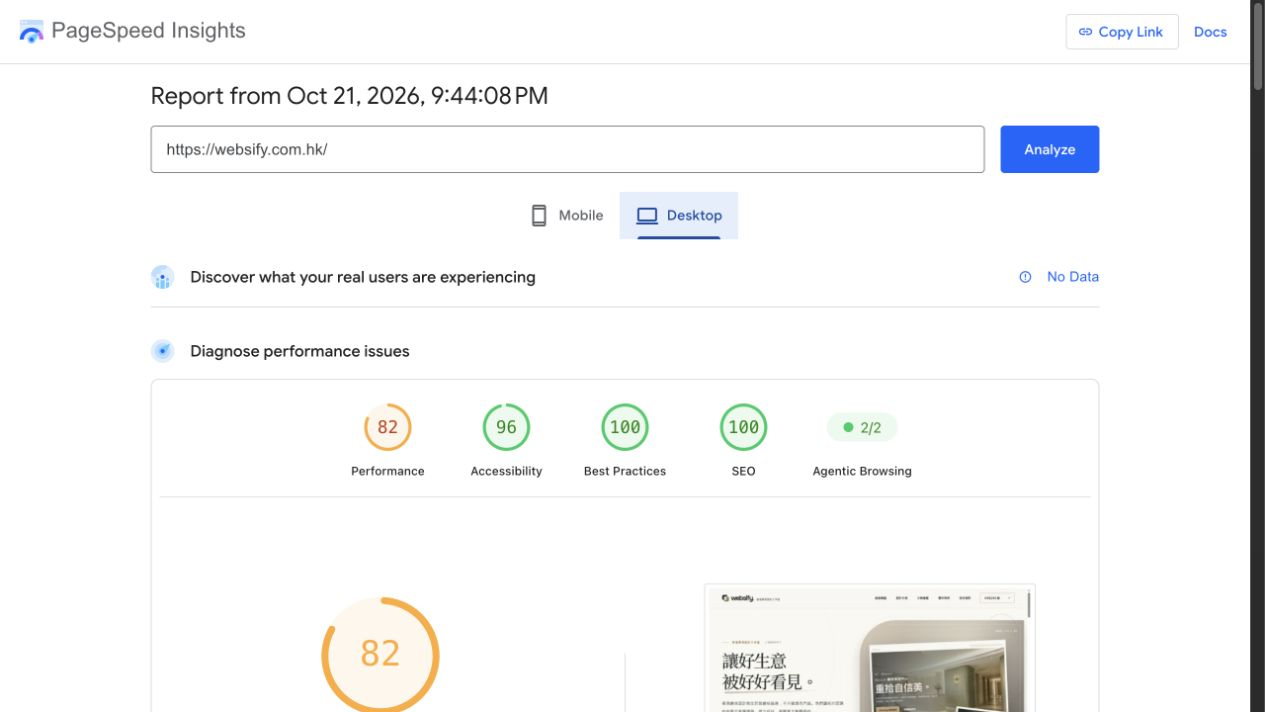
| websify.com.hk Desktop | 82 | 96 | 100 | 100 |
On a smaller screen, scroll the table sideways to see all four categories.
How this compares with our target: none of these four Performance results reached 95+. Accessibility was 96 and Best Practices and SEO were 100 in all four reports. Those are useful results in their own categories; they do not replace the remaining performance work. A 95+ build target and a dated test result describe different things.
The original screenshots, before optimisation
Each screenshot includes the tested URL, report date, selected device and category scores. Open the image for a larger view, or follow the accompanying link to the Google report.
What do these results tell us?
Both home pages recorded Total Blocking Time of 0 ms and Cumulative Layout Shift of 0 in both device modes. In these runs, the main performance concern was how quickly content appeared. Mobile Largest Contentful Paint was 11.6 seconds for the UK site and 9.3 seconds for the Hong Kong site.
The UK mobile report flagged image delivery, with an estimated 1,661 KiB saving. The Hong Kong mobile report flagged render-blocking requests, with an estimated 8,950 ms saving, as well as unused CSS. These estimates identify work to investigate; they are not guaranteed reductions. Images, stylesheets and font loading are sensible places to start, followed by another measurement.
This is where the report becomes useful: it gives a specific next step beyond simply asking for a faster website.
22 October update: fixing the mobile bottlenecks
We moved the existing heading fonts onto each website's own domain, removing the external Google Fonts stylesheet from the critical loading path. The Hong Kong home-page headline now has a preloaded 5.3 kB font subset, while the remaining characters retain the same typeface through separate Unicode ranges. We also adjusted the Hong Kong hero image sizes and loading priority.
We measured the production builds on localhost with Lighthouse 13.5.0, using its default simulated mobile conditions and an isolated Chromium browser profile. The local baseline includes image improvements already present in the UK build. The three subsequent runs were:
| Website build | Local baseline | After: run 1 | Run 2 | Run 3 |
|---|---|---|---|---|
| UK | 94 | 97 | 98 | 97 |
| Hong Kong | 80 | 99 | 100 | 100 |
Both local builds exceeded the 95+ target in all three checks, with Total Blocking Time of 0 ms and CLS of 0. These are local Lighthouse results, not new Google PageSpeed Insights results for the live websites. The dated public screenshots above remain the original record; a fresh public test is needed after deployment before replacing them.
Performance scores and Core Web Vitals
PageSpeed Insights separates a simulated Lighthouse run from historical real-user data. The latter comes from the Chrome User Experience Report and covers a rolling 28-day period. In this test session, both websites displayed “No Data” in the real-user section. That means the report could not provide that assessment; it does not establish either a pass or a fail.
The Core Web Vitals focus on three parts of the experience, with these good thresholds assessed at the 75th percentile:
- LCP, up to 2.5 seconds: when the largest visible content appears.
- INP, up to 200 milliseconds: how promptly the page responds to interactions.
- CLS, up to 0.1: how much the layout unexpectedly moves.
A high lab score does not certify a real-user Core Web Vitals pass. The 0 ms Total Blocking Time shown in our screenshots is also not an INP measurement. Google's PageSpeed Insights documentation explains why the two types of data can differ.
What our 95+ target means for your website
Websify uses our highest build standards as the default for every client. Performance is part of the design and build brief, with 95+ in the PageSpeed Insights Performance category as the target for mobile and desktop. It belongs alongside clear content, responsive layouts and a working route to an enquiry.
Working towards that target means choosing appropriately sized images, keeping unnecessary JavaScript and CSS out of the page, considering font loading, reserving space for media and testing the important entry pages. External booking tools, videos and other integrations need to be considered as part of that work too.
The result still needs to support the business. We assess performance alongside readable text, keyboard access and usable contact forms. Our guide to responsive web design explains the layout side of that experience.
Try the test on your own website
- Open PageSpeed Insights, paste the exact page URL and select Analyze.
- Review Mobile and Desktop separately. Record the date and the device with each score.
- Read the metrics and suggestions below the score. Look for the largest loading bottleneck before making changes.
- Test key service and landing pages as well as the home page.
- After an improvement, repeat the test under comparable conditions and check the page's real interactions.
Common questions
Does 95+ mean a guaranteed score on every test?
It is our build and optimisation target. Scores can change with test conditions, content, integrations and Lighthouse updates. A useful report records the page, device and date, then shows where the result meets the target or needs more work.
Does 100 in SEO guarantee a top Google ranking?
No. It reflects the automated checks included in that category. Content relevance, competition and other search factors still matter. Google explains the role of real-user performance in its Core Web Vitals and Search guidance.
Why check mobile even when desktop looks fast?
The simulated device and network conditions differ. Our own results show why each deserves attention: the UK home page scored 90 on desktop and 68 on mobile in the same report. A desktop score cannot stand in for the mobile experience.
If you want a considered website with performance included in the brief, explore Websify's web design service or tell us about your project.
Sources: Google: About PageSpeed Insights; Chrome: Lighthouse performance scoring; web.dev: Web Vitals; Google Search Central: Core Web Vitals. Sources and live reports checked on 21 October 2026. Screenshots are dated records of the tested home pages, not site-wide or future performance guarantees.